Home – troff and its companion programs


troff reads one or more files containing troff source and produces device-independent troff output. This device-independent output is then turned into a suitable format for a particular device by a post-processor. Because drawing equations, tables, etc., in low-level troff source is tedious, pre-processors exist which recognise higher level descriptions in their own ‘little languages’ interspersed with the troff source and replace it with the low-level equivalent. Similarly, ‘macro packages’ exist which contain definitions of often used pieces of troff source saving repetition and giving consistency throughout a document.
In the diagram, tbl is shown as the first pre-processor and is used for typesetting tables. Next, pic, a pre-processor for drawing pictures, like the diagram itself, replaces any picture definitions with troff commands. Finally, troff itself gets to layout the pages of the document and outputs a device independent description. As letter.tr uses the ‘mm’ macro package troff reads in the tmac.m file containing the macro definitions. troff's device-independent output is then turned into PostScript using one of the post-processors, grops.
tbl is used to produce elegant tables. It assumes lines between ‘.TS’ and ‘.TE’ are a table description in its own little language. Here's an example table based on one given in M. E. Lesk's paper on tbl.

This is its source code.
.TS
tab(:);
c s s
c | c | c
l | l | n.
Major New York Bridges
=
Bridge:Designer:Length
_
Brooklyn:J. A. Roebling:1595
Manhattan:G. Lindenthal: 1470
Williamsburg:L. L. Buck:1600
_
Queensborough:Palmer &:1182
\^:  Hornbostel:\^
_
Triborough:O. H. Ammann:1380
\^:\^:383
_
Bronx Whitestone:O. H. Ammann:2300
Throgs Neck:O. H. Ammann:1800
_
George Washington:O. H. Ammann:3500
_
.TE
Similarly, pic draws pictures from the descriptions bounded by ‘.PS’ and ‘.PE’ lines. The diagram at the top of this page was drawn using
.PS
lineht = lineht / 2

box "\fIletter.tr\fP"
arrow
circle "tbl"
arrow
Eqn: circle "eqn"
arrow
Troff: circle "troff"
arc cw
line down
arc cw
left
arrow
circle "grops"
arrow
box "\fIletter.ps\fP"

up
line <- from Troff.n
arc
line
box "\fItmac.m\fP"
.PE
Neatly typeset equations are produced by eqn. This one is from Brian W. Kernighan and Lorinda L. Cherry's eqn user guide.

.EQ
G(z) ~=~ e sup { ln ~ G(z) }
    ~=~ exp left ( sum from k>=1 { S sub k z sup k } over k right )
    ~=~ prod from k>=1 e sup { S sub k z sup k /k }
.EN
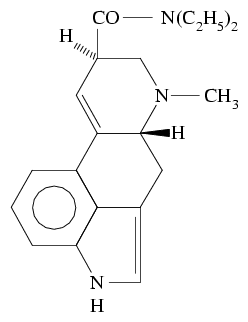
chem is an awk script that produces pic output depicting a chemical structure diagram, i.e. it's a pre-processor for a pre-processor. Here's Lysergic acid dethylamide, also known as LSD, courtesy of Brian W. Kernighan's chem release.

.cstart
B:  benzene pointing right
F:  flatring5 pointing left put N at 5 double 3,4 with .V1 at B.V2
    H below F.N
R:  ring pointing right with .V4 at B.V6
    front bond right from R.V6 ; H
R:  ring pointing right with .V2 at R.V6 put N at 1 double 3,4
    bond right from R.N ; CH3
    back bond -60 from R.V5 ; H
    bond up from R.V5 ; CO
    bond right ; N(C2H5)2
.cend
dformat is an awk script that produces pic output depicting data structures that comprise of one record per line, with each record containing fields. It was written by Jon Bentley and described in his paper ‘DFORMAT — A Program for Typesetting Data Formats’.
Like chem, it produces pic output. Here's two examples, one from Bentley's paper, the other describes the layout of the X11 Window System's ConnSetup protocol reply.

.EQ
delim @@
.EN
.begin dformat
style bitwid 0.08
style charwid 0
style recspread 0.3
noname
        --16 Frame
        --16 Frame
  A1:   --16 Frame
        --16 Frame
        --8-dashed ...
noname
  A2:   8--8 Flags
        8--8 Status
        --8 @roman Chunk sub 1@
  B1:   --8 @roman Chunk sub 2@
        --8-dashed ...
        --8 @roman Chunk sub m@
        16--16 CRC
  A3:   8--8 Flags
noname
  B2:   8--8 @roman Data sub 1@
        8--8 @roman Data sub 2@
        8--8 @roman Data sub 3@
        8--8 @roman Data sub 4@
        --8-dashed ...
        8--8 @roman Data sub {n-1}@
        8--8 @roman Data sub n@
        6--6 Length
  B3:   10--10 Channel #
pic line dotted from A1.sw to A2.nw
pic line dotted from A1.se to A3.ne
pic line dotted from B1.sw to B2.nw
pic line dotted from B1.se to B3.ne
.end

.begin dformat
style bitwid 0.16
style recspread 0
noname
    0-31-32 release
noname
    32-63-32 ridBase
noname
    64-95-32 ridMask
noname
    96-127-32 motionBufferSize
noname
    128-143-16 nbytesVendor
    144-159-16 maxRequestSize
noname
    160-167-8 numRoots
    168-175-8 numFormats
    176-183-8 imageByteOrder
    184-191-8 bitmapBitOrder
noname
    192-199-8 bitmapScanlineUnit
    200-207-8 bitmapScanlinePad
    208-215-8 minKeyCode
    216-223-8 maxKeyCode
noname
    224-255-32-dashed pad2
.end
grap. dot. refer. bib. ideal. grn. g3.
Literate programming. One or two of the Stevens books mentions using ‘Dave Hanson's loom program’... is the source available anywhere? this looks hopeful: ftp://ftp.cs.princeton.edu/pub/people/drh/loom.tar.gz since it's on Hanson's own ftp space. DRH's home page is http://research.microsoft.com/~drh/
FPIC, LaTeX output only? — https://www.usenix.org/publications/library/proceedings/dsl97/full_papers/kamin/kamin_html/kamin.html
deroff — http://www.moria.de/~michael/deroff/
From:    philippe@crabus.net
Subject: Re: [Groff] Gantt Chart (fwd)
Date:    Sat, 20 Apr 2002 15:09:20 +0200 (CEST)

> Is it possible that you may place the Tcl preprocessor on the Internet
> somewhere for others to make use of in the future?

Yes, but it's just a quick made tool.

You can find it at:
http://www.epita.fr:8000/~lamira_p/groff/
Copyright Ralph Corderoy, 2001, 2002, 2003.